

S&P 500 Futures Daily Insights for Tue 21 Mar 2023
Poor Structure Above and Below Makes Sudden Directional Shifts more likely

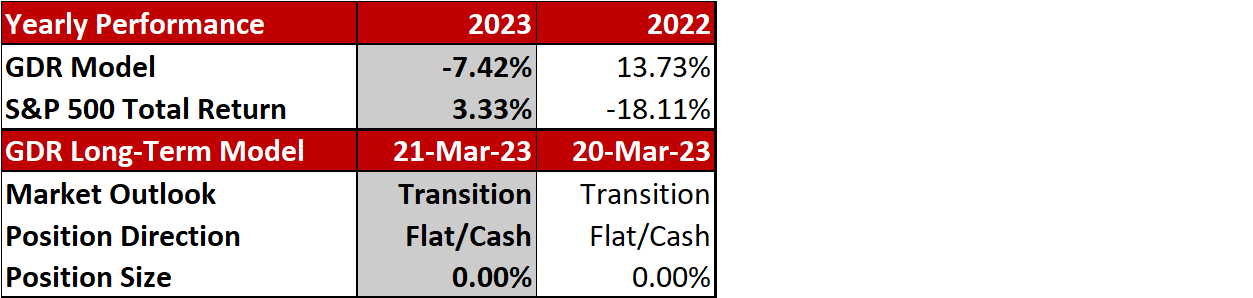
GDR Model Insights for the Current Week
S&P 500 Futures Market Profile Insights for Today
Near-Term Outlook: Bullish as Value Builds Higher with Poor Structure Above
Counterpoint: Liquidation at the Top of Balance Zone
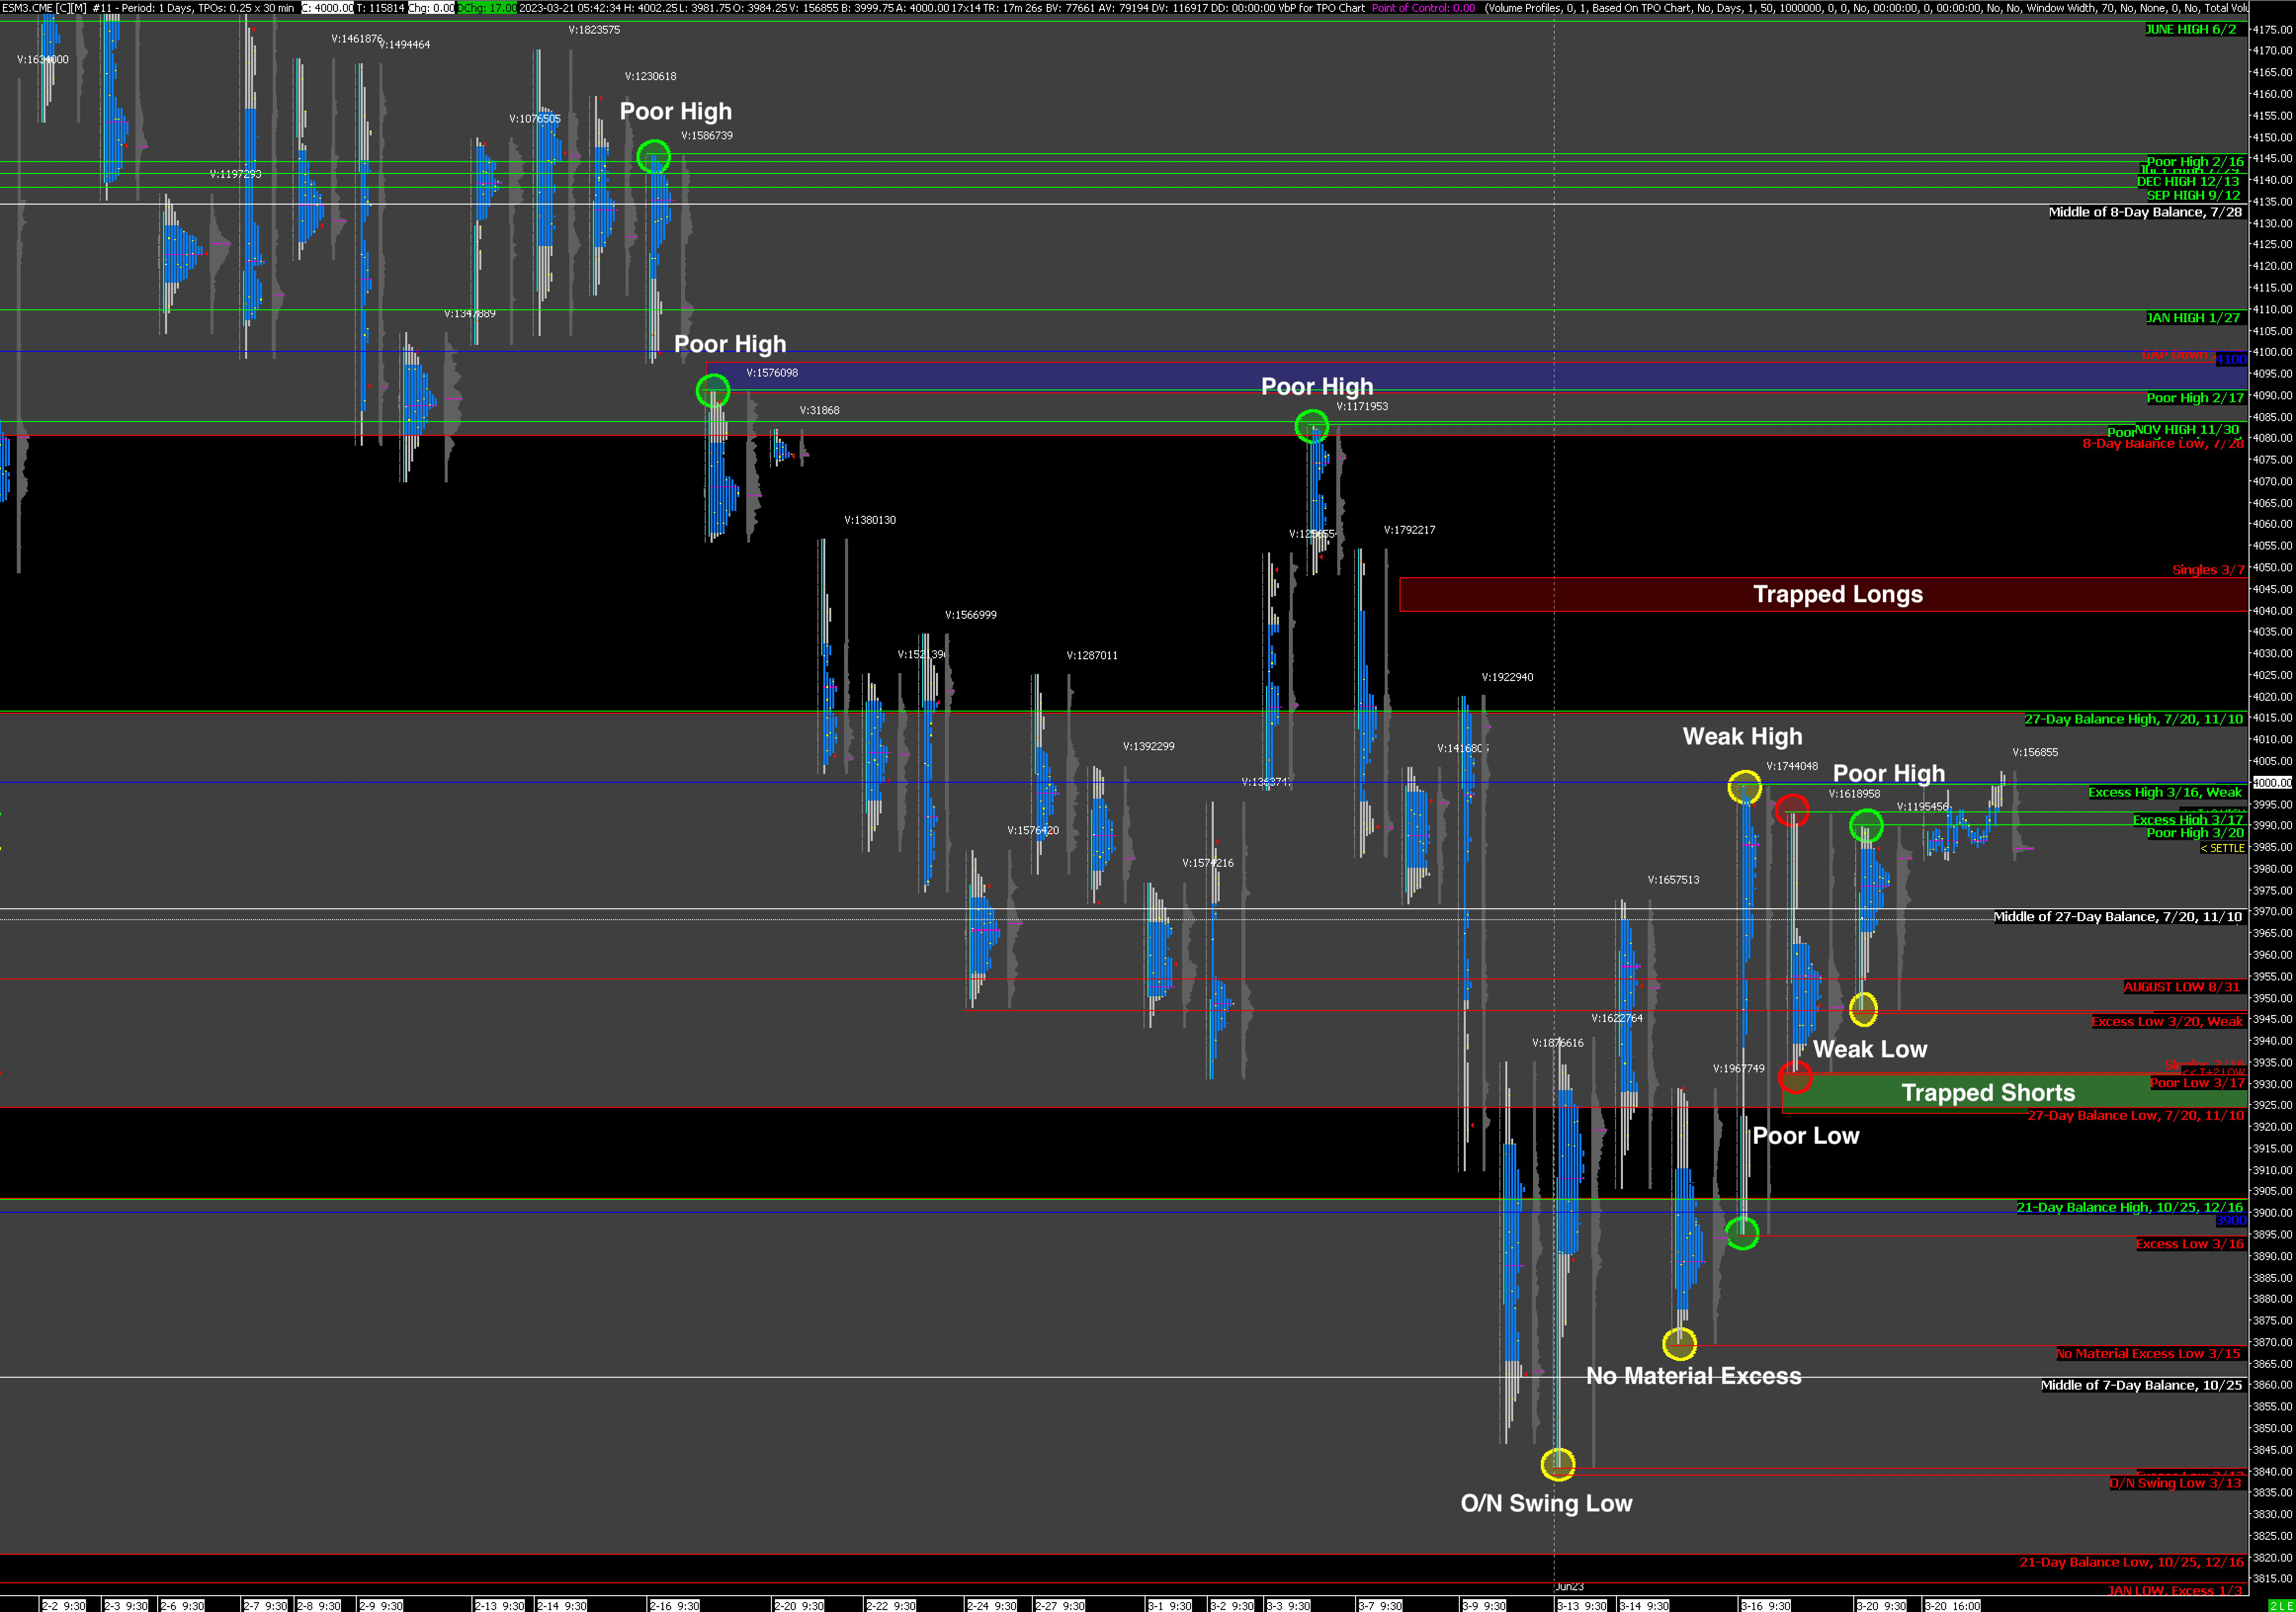
Yesterday was dominated by momentum traders again as suggested by the exacting levels prevalent - the market left behind a Poor High and while the Low has Excess, it is Weak as it is exactly at the previous day’s Settlement Price. In today’s chart, I’m highlighting the key evidence over the last month or so that suggests that the market has been dominated by short timeframe traders. It’s remarkable how poor the Market Structure is both above and below, making sudden directional shifts more likely.
Here are some key levels for the day:
Bullish: 3990 (Poor High), 4016 (Top of Current Balance Zone), 4048 (Trapped Long Position)
Bearish: 3946 (Weak Low), 3932 (Poor Low), 3924 (Bottom of Current Balance Zone, Trapped Short Position)
Potential Market-Moving Events Today
10:00am - Existing Home Sales