

S&P 500 Daily Perspective for Fri 26 May 2023
Balanced with a slight bullish edge

GDR Model Insights for the S&P 500
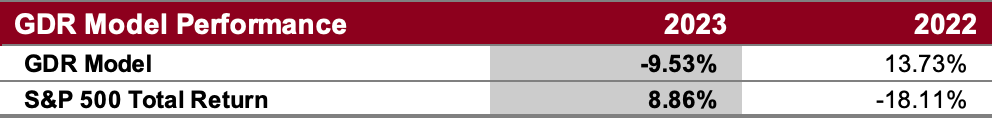
GDR Model Performance
This year has been challenging for the GDR Model’s style due to low confidence in the market.
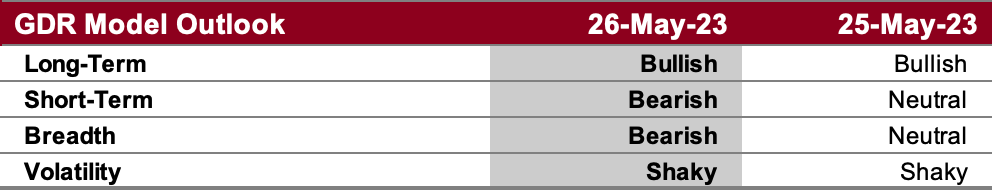
GDR Model Outlook
The GDR Model weakened materially over the last couple of days and is now bearish to neutral.
GDR Model Position
Despite the positive day, the GDR Model detected weakness in the market and opened a short position.

S&P 500 Futures Market Profile Analysis
Near-Term Outlook: balanced, could go either way but slight bullish edge
Alternate Outlook: N/A
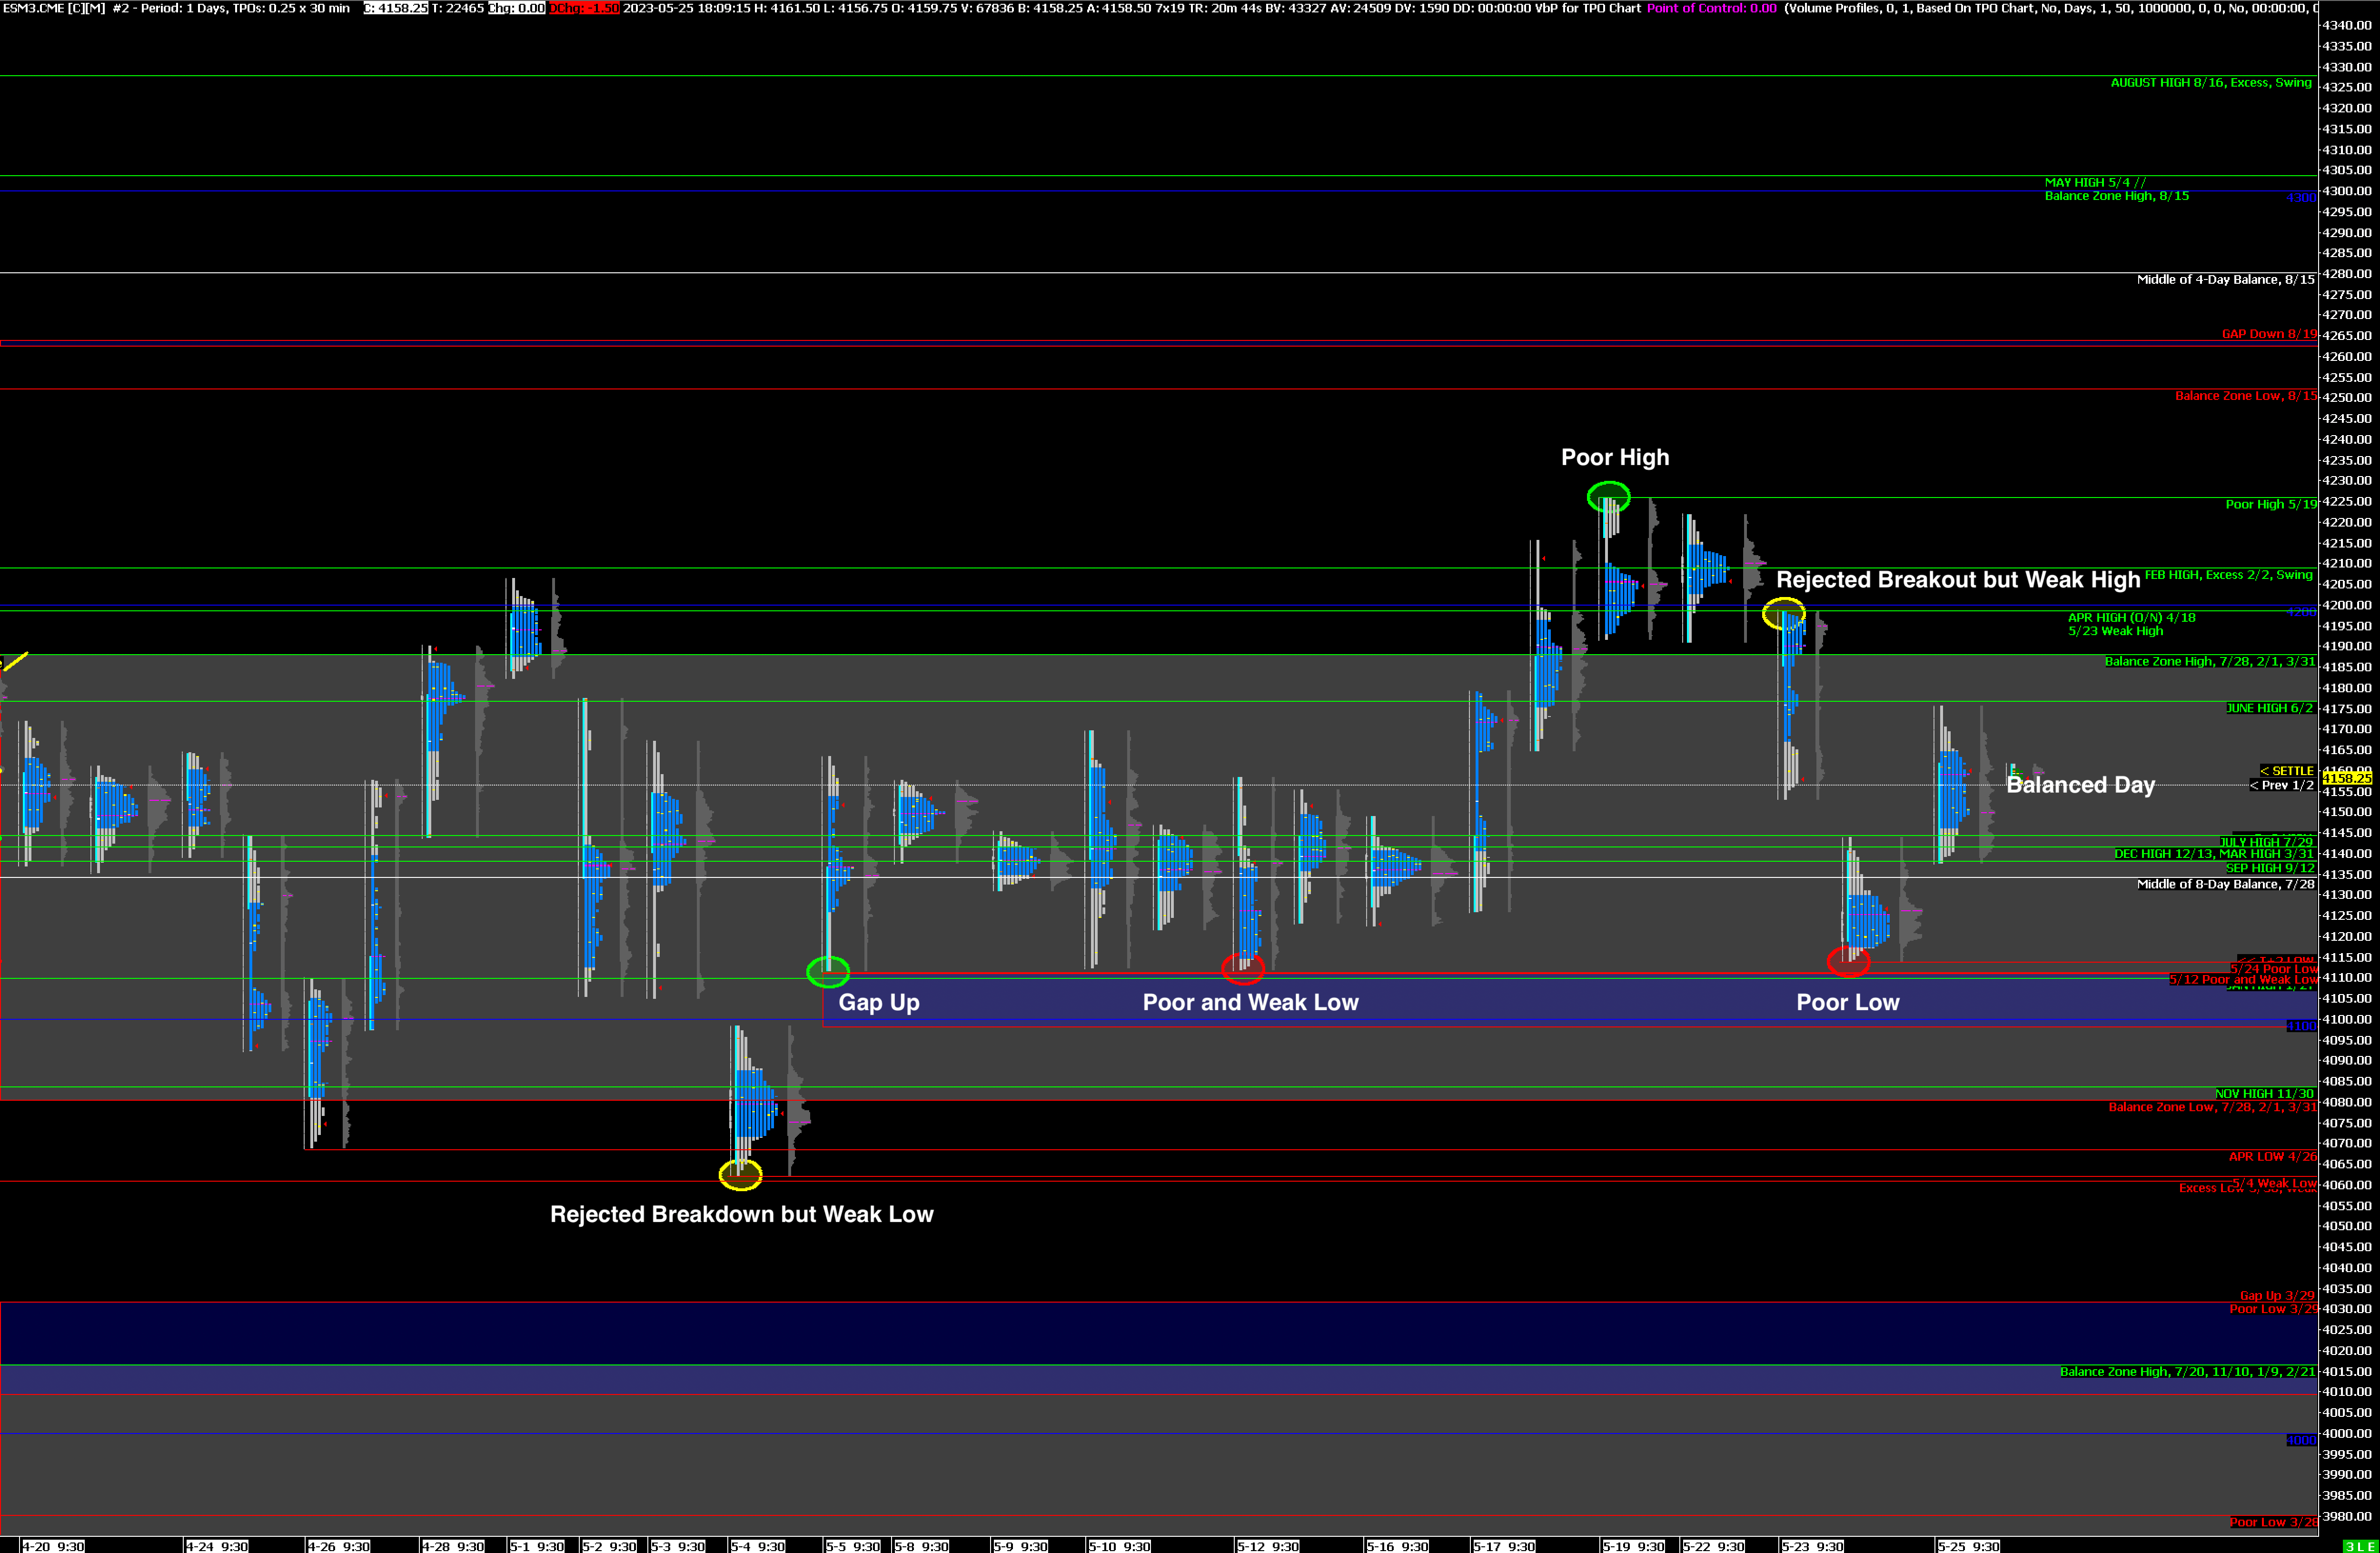
Key Levels
Bullish: 4176 (Prev High), 4188 (Top of Lower Balance Zone), 4198 (Weak High, April High), 4226 (Poor High)
Bearish: 4138 (Prev Low), 4114-4111 (Poor Low and Weak Low, Trapped Shorts), 4098 (Closes Prev Gap Up)
Market Narrative
The market opened on a gap up that filled fairly quickly. However, we ended up seeing a trend up day that finished in balance. Balance trading guidelines can be applied with edges on the day’s high and low. There is a slight bullish edge but definitely not enough to blindly go long without monitoring how the day develops. Due consideration to poor structure still in need of repair (see chart above) as well as key data coming out tomorrow.
Economic Calendar
8:30am - PCE, Durable Goods Orders
10:00am - Michigan Consumer Sentiment
Next Week: Nonfarm Payrolls (Fri)