S&P 500 Daily Perspective for Thu 2 Jan 2025

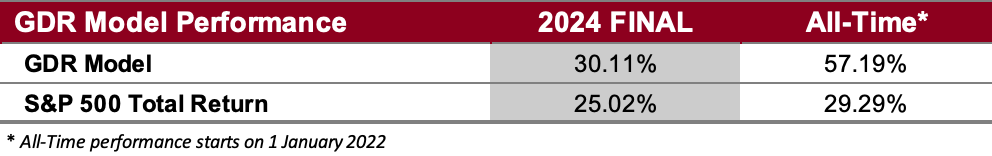
GDR Model Performance
Please see the Performance page for more detailed performance numbers, how they’re calculated and a chart.
The GDR Model beat the market in 2024 by 509 basis points. It’s beating the market since inception by 2,790 basis points. I will do a year in review post soon.
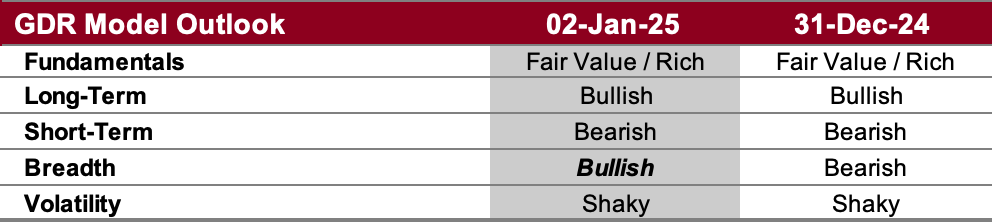
GDR Model Outlook
The GDR Model is neutral. Today the market strengthened on the Long-Term Outlook but weakened on the Short-Term Outlook. This may be the beginning of a crossroads and this divergence is one of the symptoms.
Fundamentals Outlook (as of 17 Jun 2024): for the first time in a while the model showed stocks as being richly valued (i.e. overpriced). Note that this is just a barometer to help guide longer-term decision-making rather than short-term market timing.
Long-Term Outlook (as of 27 Dec 2024): the market weakened significantly through last week. If this persists the model may turn overall bearish, which would significantly increase the odds of a protracted sell-off.
Short-Term Outlook (as of 31 Dec 2024): the market showed short-term strength this morning, but it returned to weakness in the afternoon causing the sell-off for the day.
Breadth Outlook (as of 31 Dec 2024): breadth is bullish, but unless the the market is strong in both the long and short-term timeframes, it doesn’t mean higher odds of positive returns.
Volatility Outlook (as of 31 Dec 2024): the market remains volatile. This increases the odds of significant sell-offs, but can also cause higher daily returns on due to short-covering rallies.
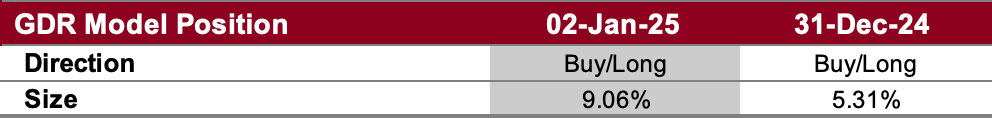
GDR Model Position
The GDR Model is effectively flat at this point. It’s not uncommon for the model to pare back risk as it waits for the market to definitively pick a (longer-term) direction to move in.