

S&P 500 Daily Perspective for Mon 1 May 2023
Challenging Top of Balance Zone going into Fed Week

GDR Model Insights for the S&P 500
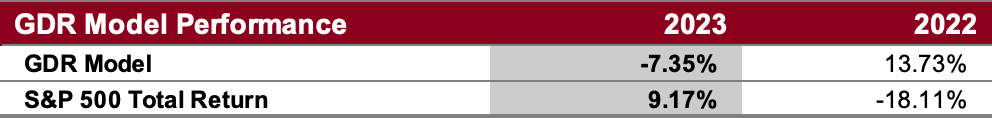
GDR Model Performance
The GDR Model returned 1.82% in April vs the S&P 500’s 1.56%, modestly outperforming the index by 26 basis points. April was marred by possibly the most indecisive market in the last 3 years. Overall this year has been challenging for the Model’s style due to low confidence in the market.
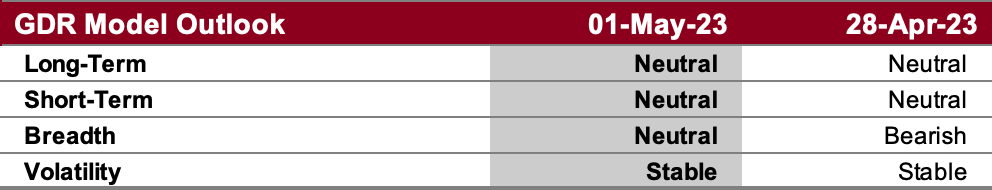
GDR Model Outlook
The overall Model is probably as Neutral as ut can possibly get at this point. However, it did pick up on strength at the end of last week. Should it continue, it will likely enter a Long position soon.
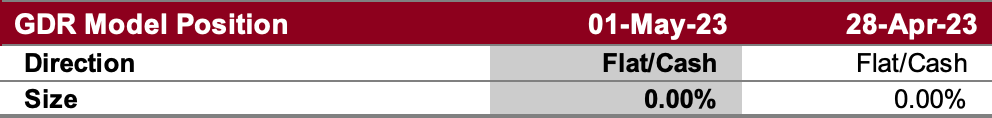
GDR Model Position
Despite the improvement at the end of last week, the model is still not committing to a position as there is not enough conviction.
S&P 500 Futures Market Profile Analysis
Near-Term Outlook: At Top of Balance Zone, monitor for continuation
Alternate Outlook: N/A
Key Levels for Today
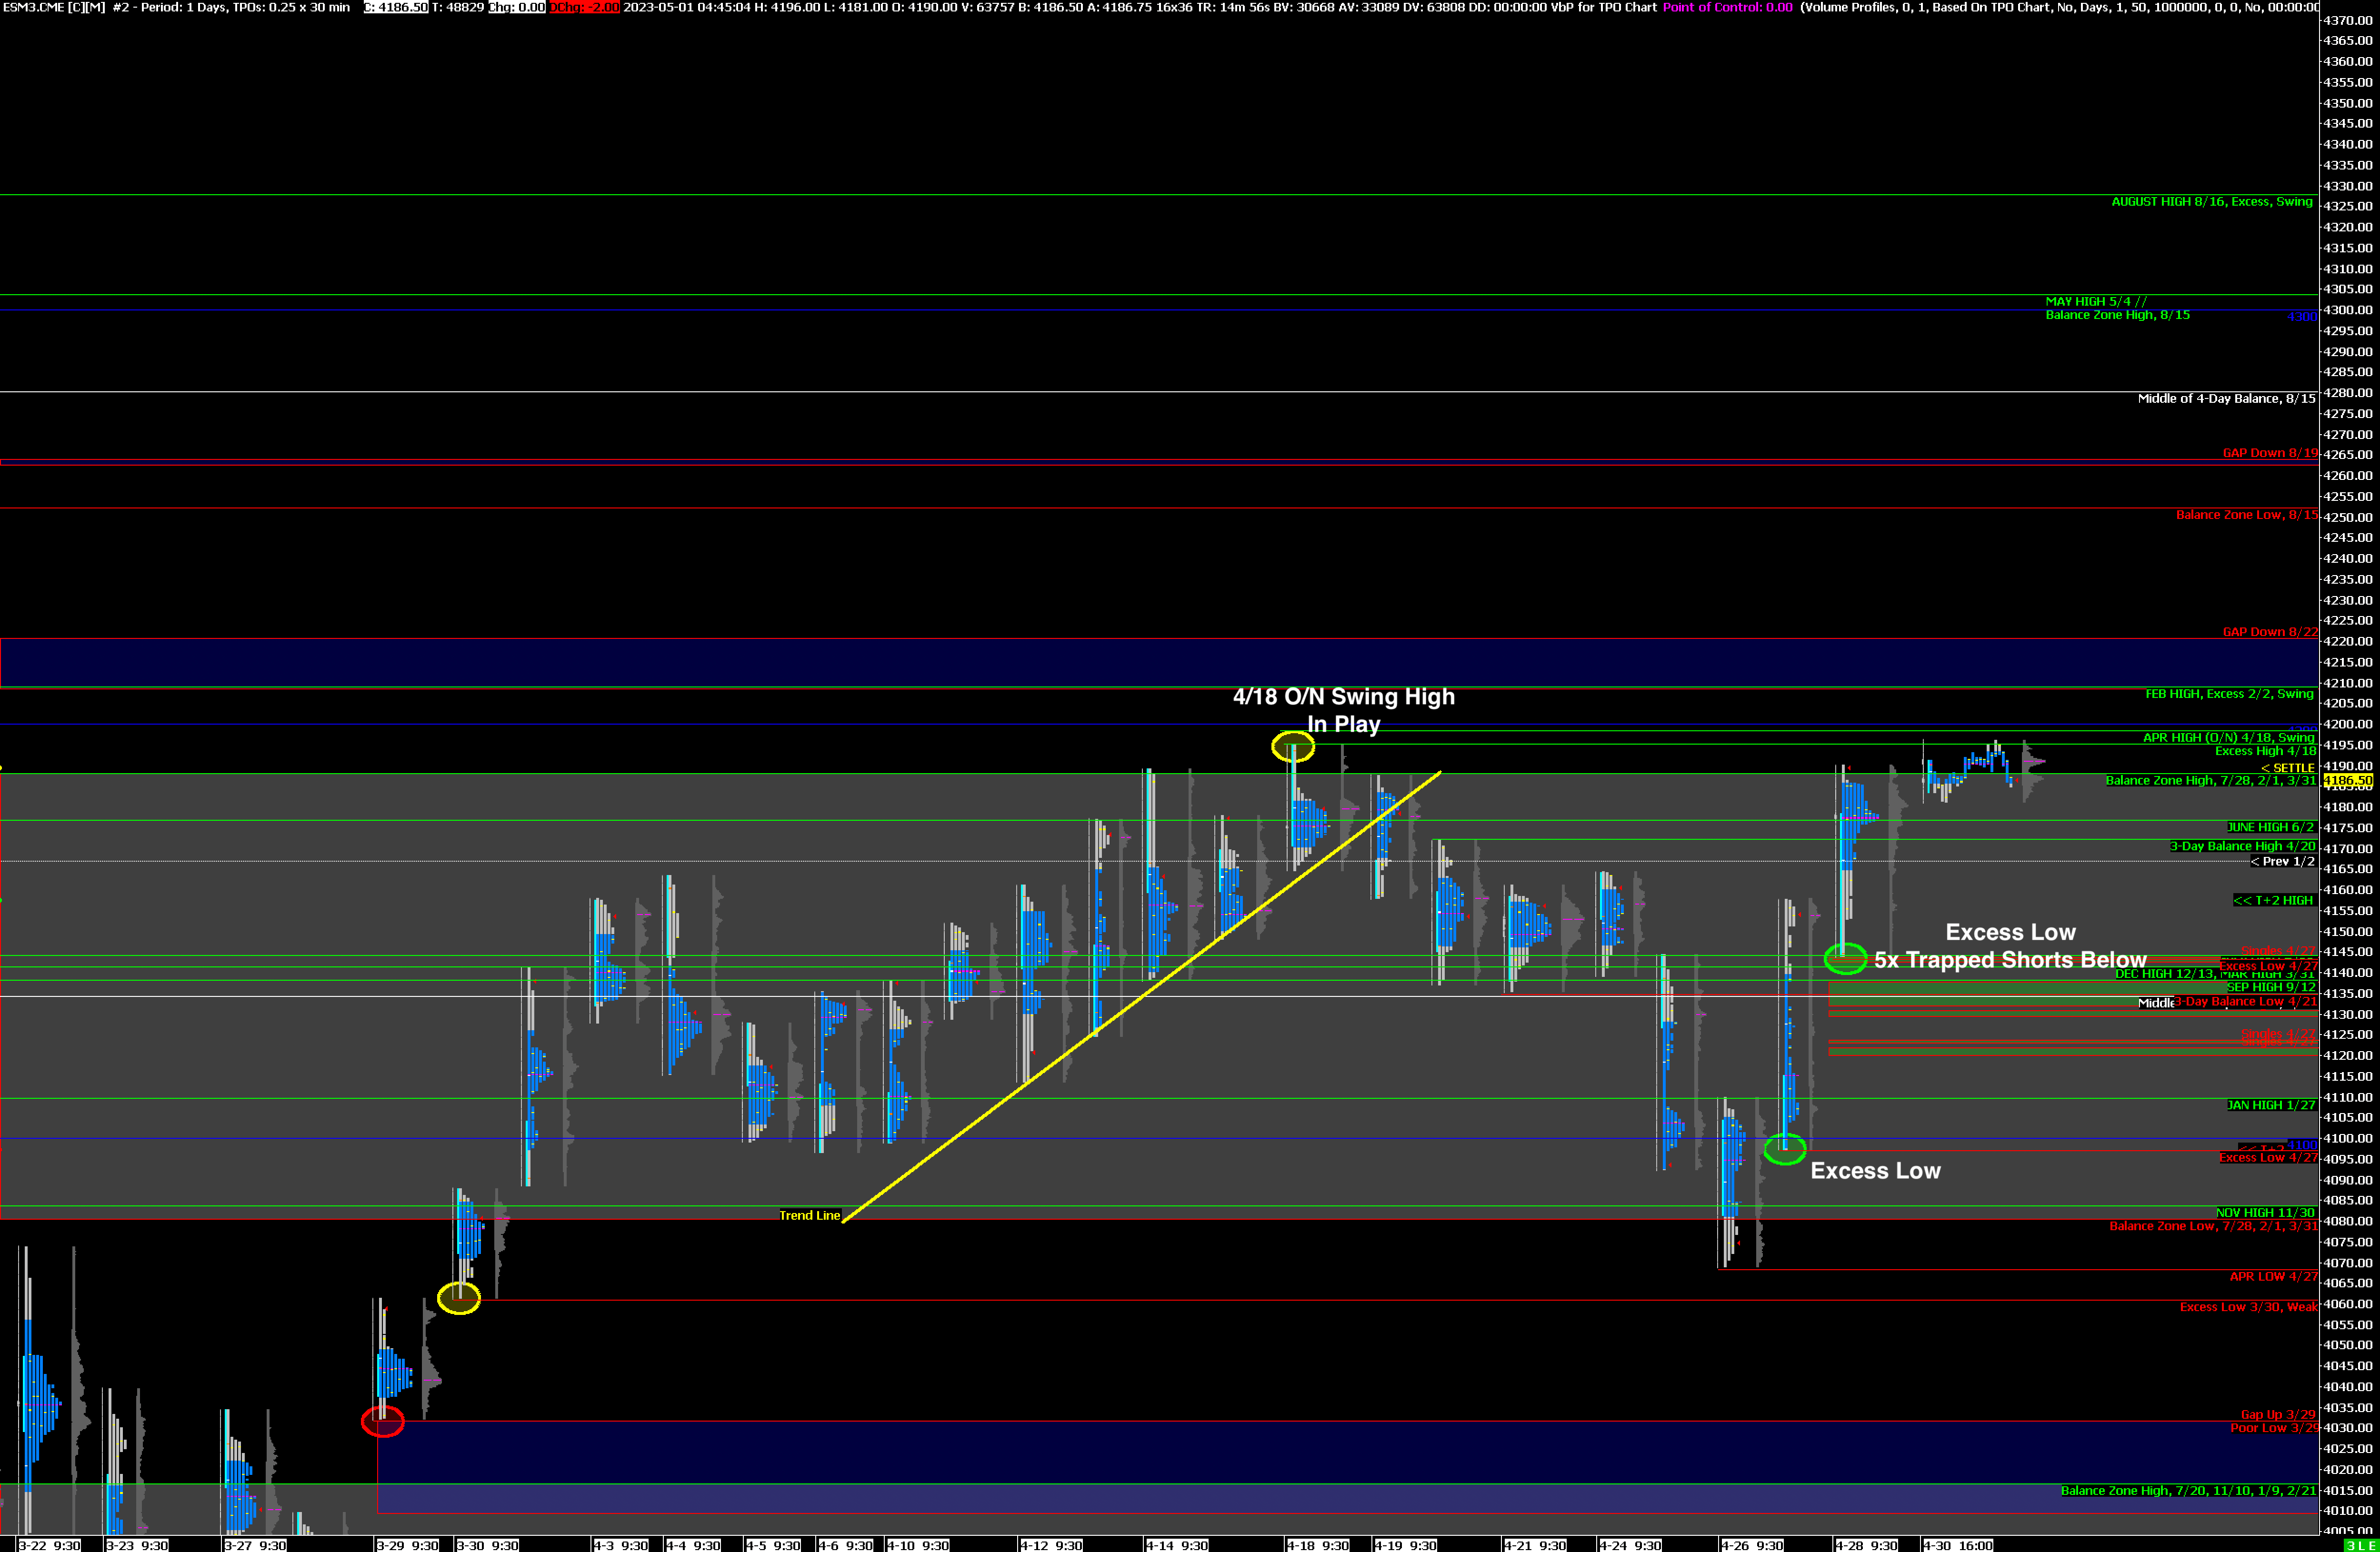
Bullish: 4188 (Top of Current Balance Zone), 4198 (O/N Swing High), 4221 (Closes Gap Down)
Bearish: 4135 (Recent Short-Term Balance Low), 4120 (Closes Recent Single Prints), 4100 (Go-No-Go Level)
Market Narrative
Friday morning continued Thursday’s Short-Covering Rally with almost no give back, so the Poor Structure from Thursday remains. The rally stopped at a logical spot, near the top of the current Balance Zone. This is now a key level: if the market trades and accepts above 4188 then there is a good chance of a breakout, starting with a challenge of the O/N Swing High from 18 April, which is also the High for the month.
A failure to breakout is more likely to lead to consolidation and Balance than more Liquidation, especially with the Fed’s Interest Rate decision on Wednesday and Unemployment data coming out Friday.
Economic Calendar
Today at 9:45am - Markit Manufacturing PMI
Today at 10:00am - ISM Manufacturing PMI
Later This Week: Fed Interest Rate Decision (Wed), FOMC Press Conference (Wed), AAPL 0.00%↑ (Thu), Nonfarm Payrolls (Fri)