S&P 500 Daily Perspective for Mon 5 Jun 2023
Bullish but some consolidation is likely
GDR Model Insights for the S&P 500
GDR Model Performance
The GDR Model returned -2.99% in May vs the S&P 500’s 0.43%, underperforming the index by 342 basis points. This year has been challenging for the GDR Model’s style due to low confidence in the market.
GDR Model Outlook
The GDR Model is now bullish following last week’s breakout from consolidation.
GDR Model Position
The GDR Model remains in cash, but is on the verge of opening a long position.
S&P 500 Futures Market Profile Analysis
Near-Term Outlook: consolidation while maintaining bullish outlook
Alternate Outlook: sustained upside to take out August 2022 high target
Key Levels
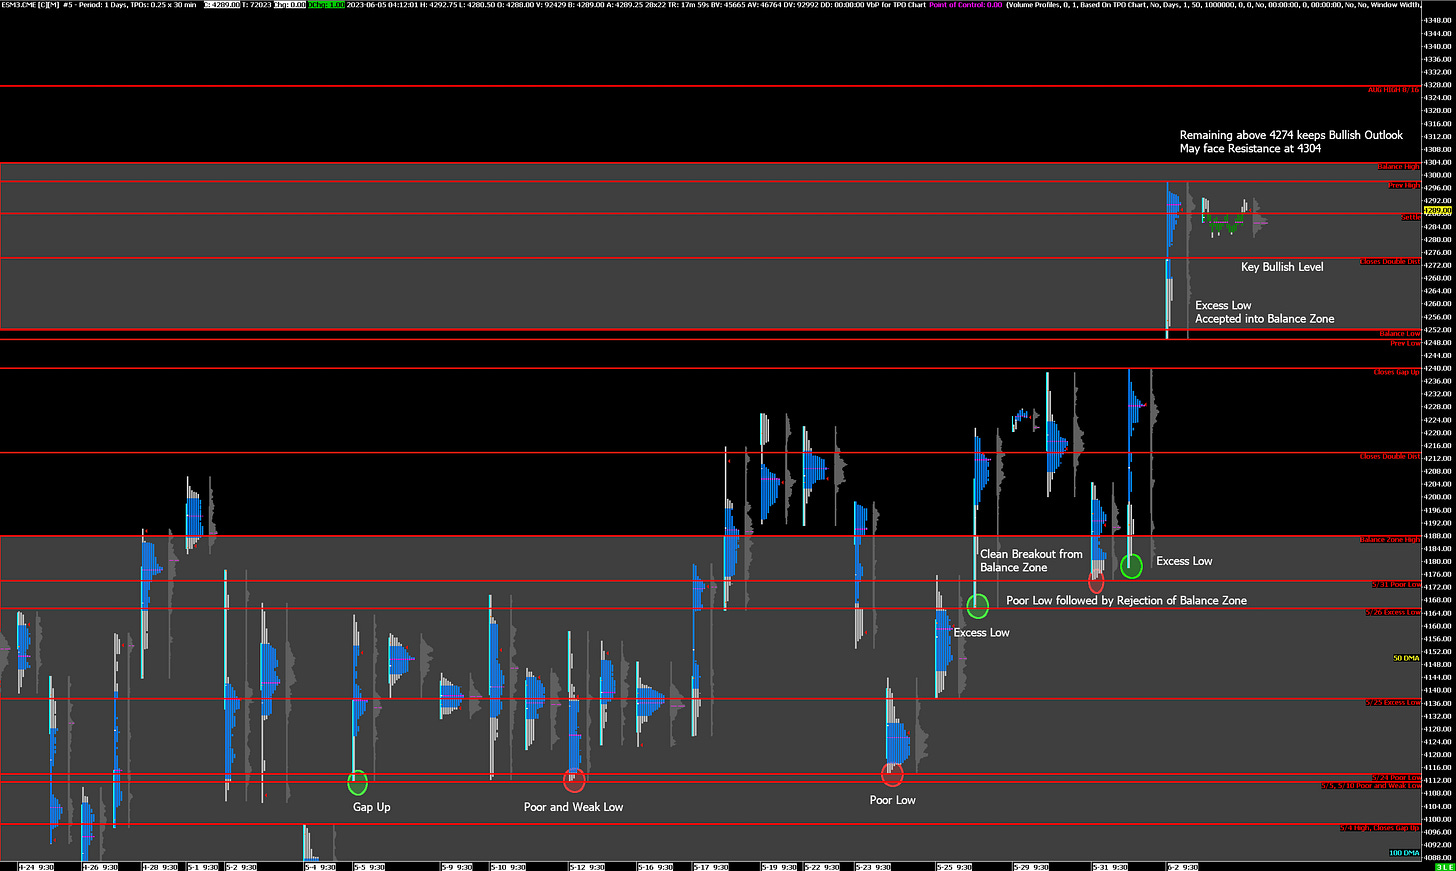
Bullish: 4298 (Friday High), 4304 (Top of Current Balance Zone), 4328 (August 2022 High)
Bearish: 4274 (Closes Double Distribution), 4252 (Bottom of Current Balance Zone), 4240 (Closes Gap Up)
Market Narrative
Last Friday the market broke out and posted a bullish trend day that included acceptance into a higher balance zone. As long as the ES is able to remain above 4274, the outlook will remain bullish. However, the market may be a bit stretched and thus some consolidation is probably more likely at this point.
This week has no notable scheduled data releases and the next logical target is the August 2022 high at 4328. However, before getting there the ES may face resistance at the current balance zone high around 4304.
Economic Calendar
9:45am - Markit Services PMI
10:00am - ISM Non-Manufacturing PMI, Factory Orders
Later this Week: none notable


