GDR Model Review: January 2025
A decent start to the year

The GDR Model returned 3.29% vs the S&P 500’s Total Return of 2.78%, beating the index by 51 basis points.
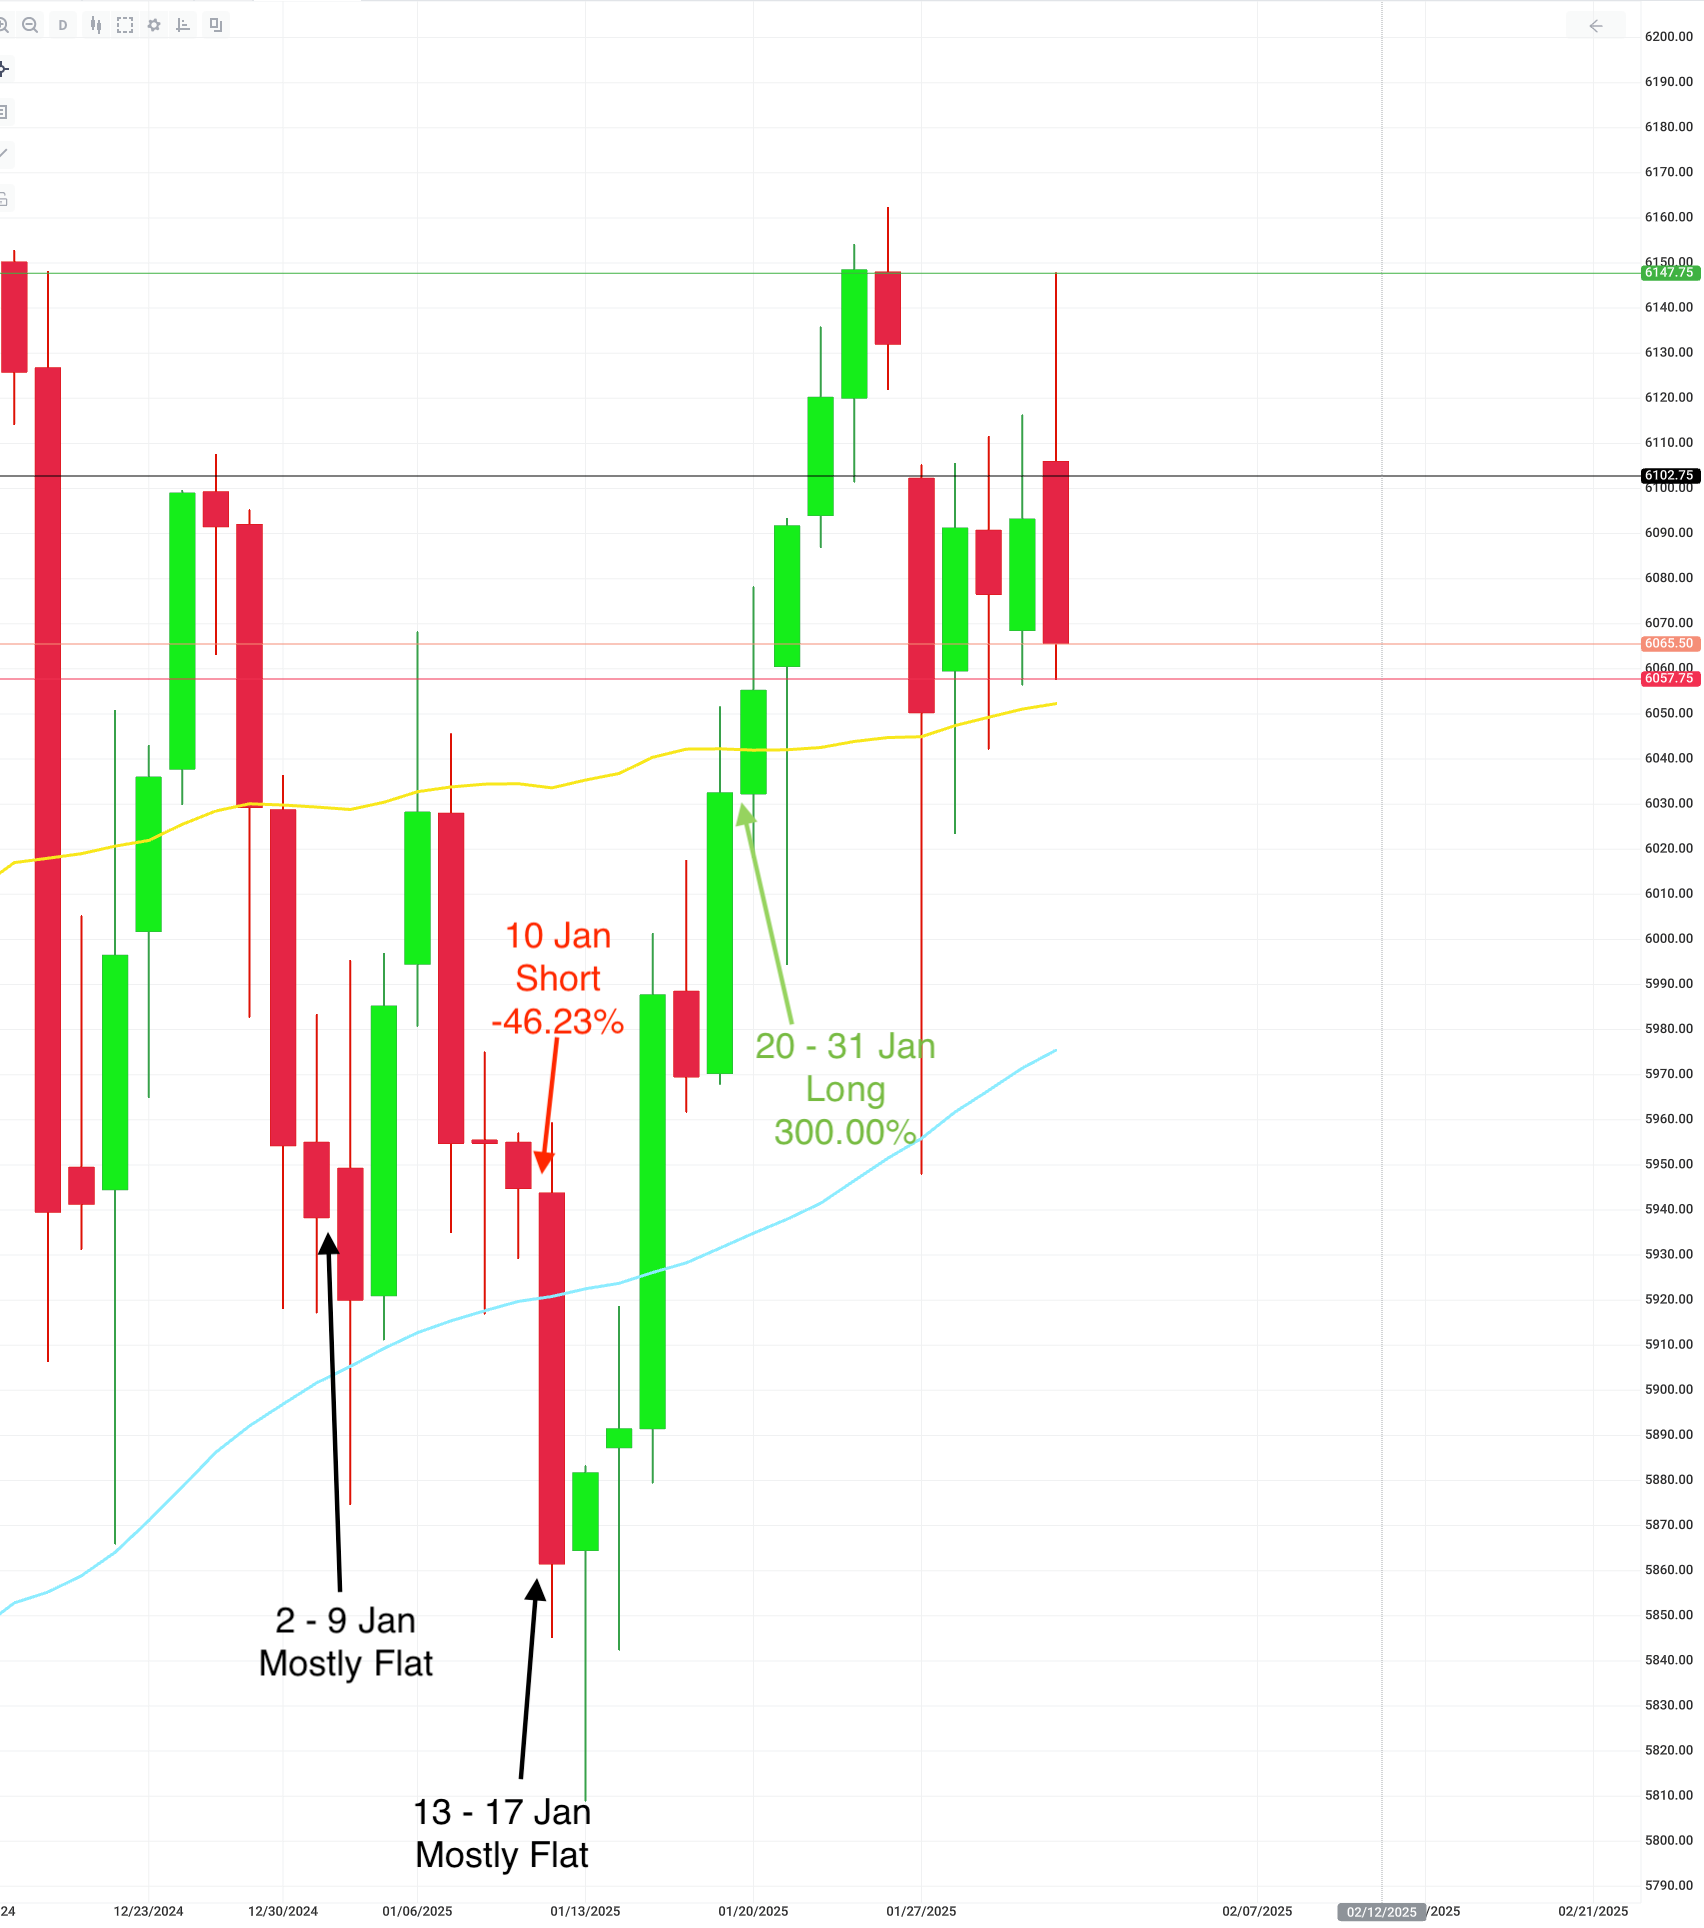
The model started out the year pretty staying mostly flat from Jan 2 all the way to the close of Jan 9. This worked out well due to the choppiness faced in the market during these days.
For Jan 10, the model opened an opportunistic short position which also worked out well as the market declined 1.53% that day.
Following that, the model returned to mostly flat through Jan 17. In terms of performance, this is not ideal since that was the bottom for the month, but this model is not made to catch exact bottoms and tops.
The model didn’t go aggressively long with a 3x long position until Jan 20, when the uptrend was already well underway. This was ok; it would have worked out better had the market not thrown a couple of curve balls on the last week of the month.
At its highest point, the GDR Model was up 7.48% on the month (close of 23 Jan), and at its worst it was down -0.02%. In terms of performance and volatility, this was a strong month.
Overall the model worked as intended: it stayed out of the market when it was choppy and it didn’t try to catch exact bottoms or tops. Instead in worked to try and catch the meat of a trend, no matter how long or short-lived it was.