

2024 GDR Model Review and GDR Investing Updates

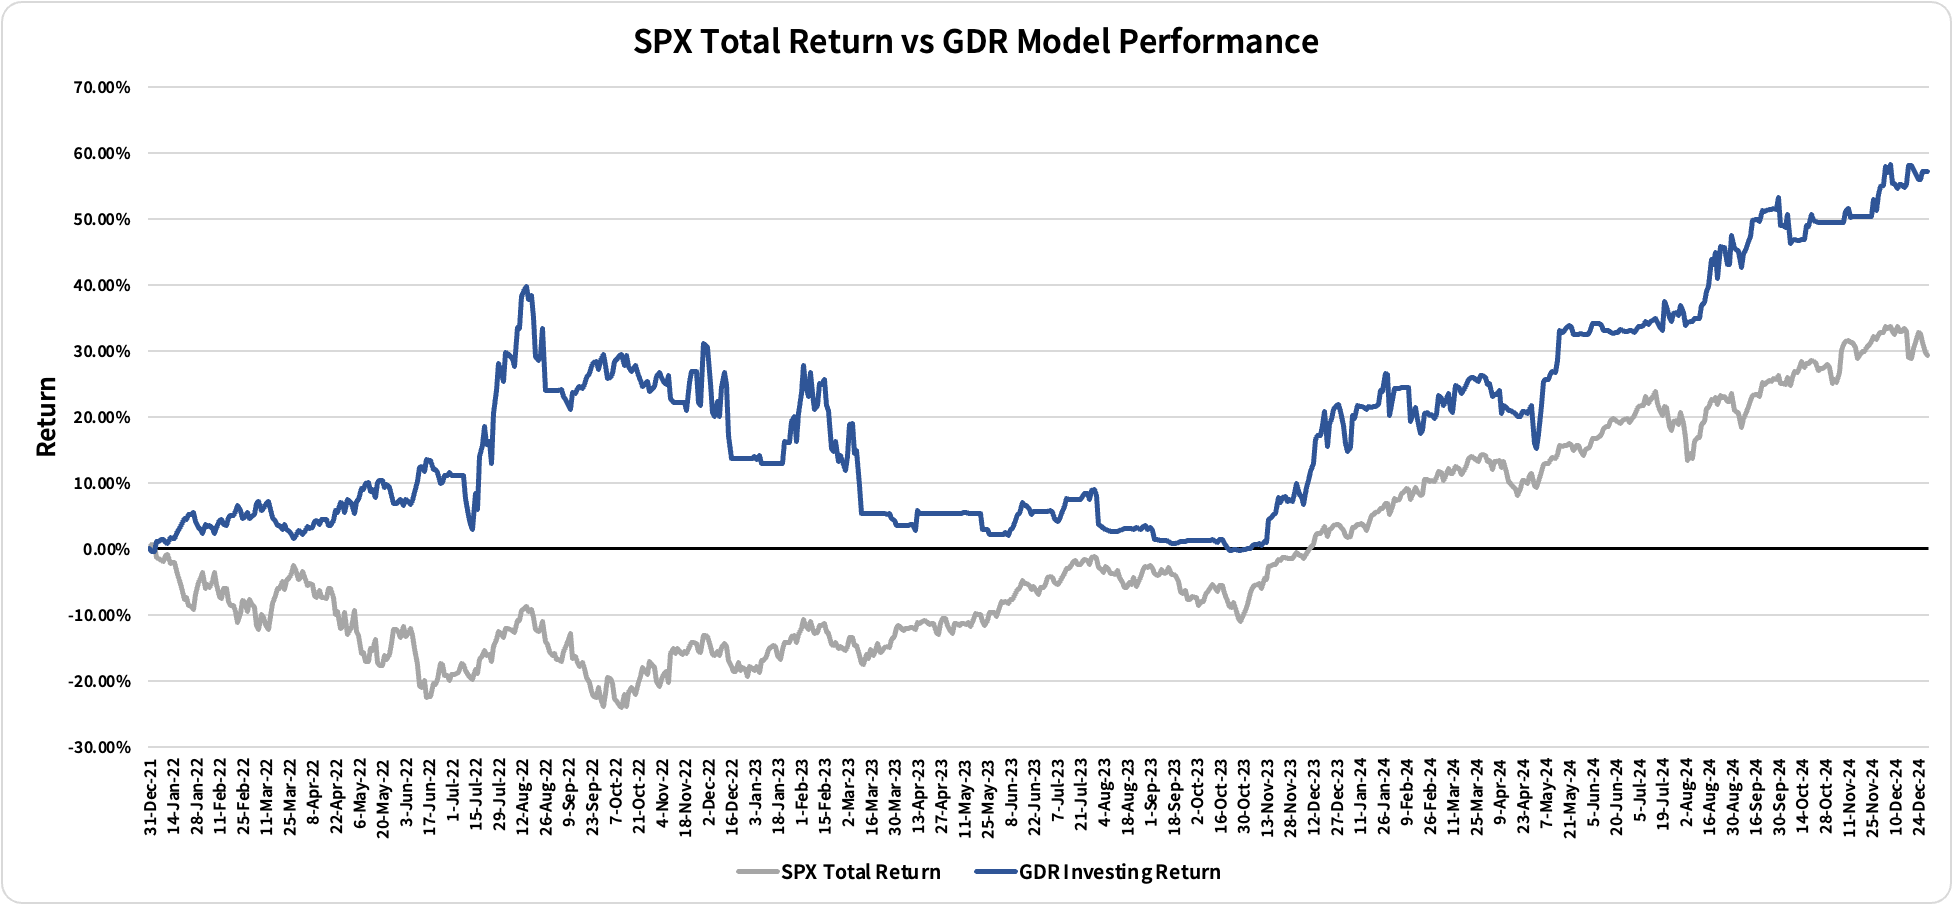
The GDR Model returned 30.11% vs the S&P 500’s Total Return of 25.02%, beating the index by 509 basis points.
2024 was still a challenging year for the GDR Model, but unlike in 2023, the model beat the S&P 500 by a healthy margin. In this post, I will review the model’s performance quarter-by-quarter as well as highlight the model updates and tweaks I implemented to improve performance and (hopefully) reduce risk.
Q1: A Tough Start to the Year
The GDR Model got off to a weak start to 2024 returning just 4.55% in Q1 vs the S&P 500’s 10.56%. This quarter, especially in February, was marked by fits and starts in the market, which “tricked” the model into increasing and reducing long positions at inoportune moments.
To address this problem, I made a slight tweak to the GDR Model that was put into production starting on 20 March. This fix addressed the issue where position sizes are adjusted with poor timing.
Q2: GDR Model 3.1
The fix implemented at the end of Q1 is v3.1 (for those of you keeping track). This resulted in a more effective model that returned 5.43% in Q2, beating the S&P 500’s 4.28%.
Within trading and investing circles you often hear people say something along the lines of “no strategy works all of the time. The best you can do is to have a strategy that works some of the time, and when it works that the profit it generates is greater than its losses when it doesn’t work.” Q2 is a great example of a time period for which the GDR Model’s style is weak. You can see it clearly in this chart of the S&P 500’s price vs the model’s positioning over 2024:
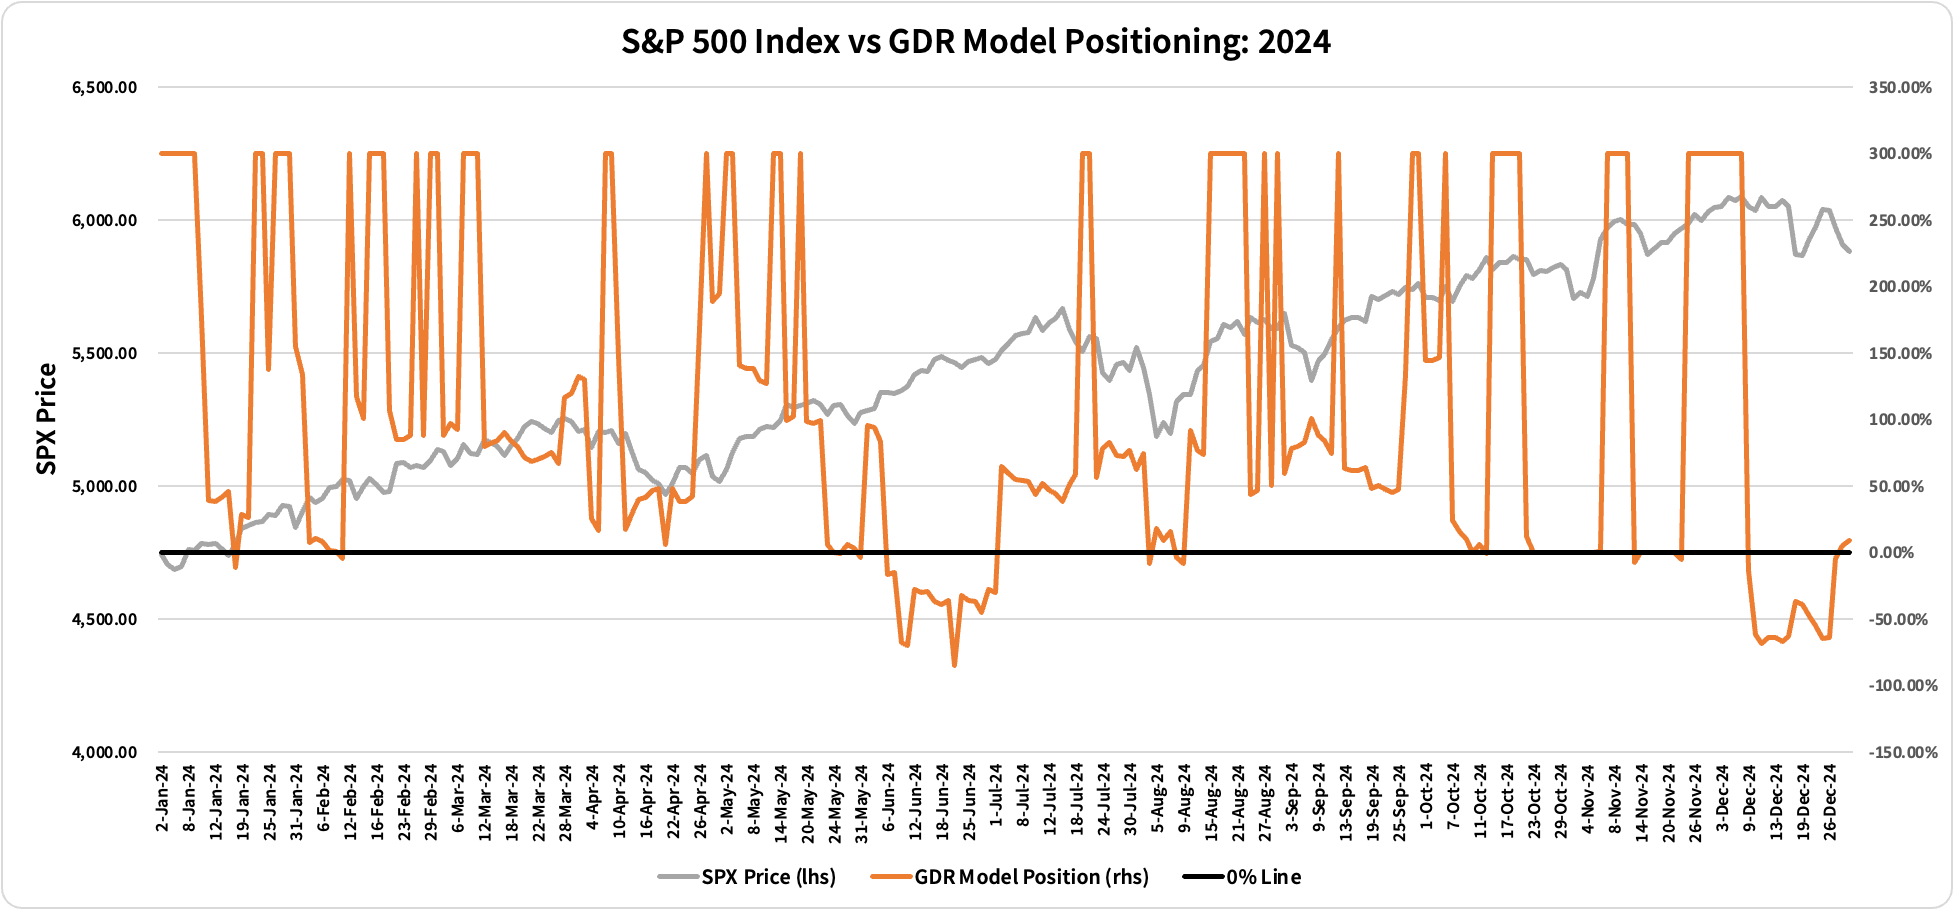
Notice that for pretty much all of June the model is slightly short while the S&P 500 is steadily rising. The GDR Model is a probabilistic model, which means that at any given point it will assess the odds of directional movement in the market and position accordingly. In June, the model perceived low odds of upside, but despite that the market still went up. This is a reality in all styles of trading and investing, including discretionary. Despite this, the model still managed to beat the market in Q2, and even though it wasn’t a strong beat, it did work as intended.
Perhaps one of the most challenging aspects of the GDR Model (which is also present in most trading/investing strategies) is that returns tend to follow the Pareto Principle; it’s short periods of time of outstanding performance that will make the big difference over the long-term, but for most of the time relative performance is mostly trivial. This reality can lead to boredom or loss of confidence in the strategy only to trick investors to give up right before another short-lived period of strong outperformance is just around the corner.
Q3: A Stellar Quarter
Q3 is an excellent example of the Pareto Principle at work. The GDR Model returned 15.15% this quarter, which far outpaced the S&P 500’s 5.89% return. This quarter alone was the most significant contributor to this year’s outperformance. Moreover, if we drill down to the monthly returns, we can see even stronger evidence of the Pareto Principle’s effect.
For July and September, the GDR Model beat the S&P 500, but somewhat narrowly:
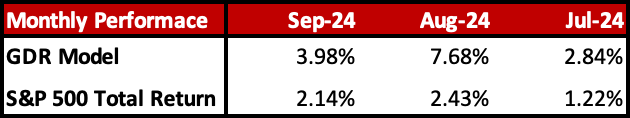
Note, however, the significant outperformance during August. The model had been underperforming the market for the year until then, and it might have been tempting for many to give up on the strategy. However, doing that only to resume implementation in September, would have meant having underperformance for the whole of 2024.
Q4: GDR Model 4.0 and 4.1
The GDR Model returned 2.51% in Q4, narrowly beating the S&P 500’s 2.41%. Definitely not a standout quarter, but as mentioned above, these will happen from time to time if not most of the time. In this case, the model took advantage of the upswings during Q4, but was unable to profit from most downswings as there wasn’t enough conviction during the sell-offs.
More importantly, even though Q3 performance was excellent, I opted to deploy v4.0 (and soon after v4.1) of the model during this quarter. The main difference between v3 and v4 of the model is that the current version places less weight on the fundamentals part of the model and focuses more on the market-timing aspect. While I expect this change to increase the volatility of returns, I also expect the increase in returns to more than make up for it.
Conclusion and Upcoming Changes to the GDR Investing Service
On one hand, even though the GDR Model beat the market, the margin of the outperformance wasn’t as strong as I’m aiming for with this model. For reference, I’m aiming for something more like 2022 in terms of relative performance.
On the other hand, even though the model underperformed in 2023, it has made money every single year out of the three I’ve been publishing it. Moreover, the 2024 return just above 30% is very much in line with my goals for absolute performance. I feel that these are achievements in and of themselves (the S&P 500 certainly can’t claim the same money-making track record in this time period). In light of this, the GDR Performance Guarantee will now depend on two components: 1) the absolute performance of the model, and 2) the relative performance to the S&P 500 Total Return Index.
The GDR Model has two goals: make money every year and beat the S&P 500’s total return. Going forward, for those of you who have been paying subscribers since before Q4 of each calendar year, every time the model fails to achieve both goals, you will receive a full year of the subscription for free. If the model only fails to achieve only one of the goals, but succeeds in the other, you will receive half year of the subscription for free. Of course, if the model achieves both goals for the calendar year, there will be no freebies 😉
As for the other change to the GDR Investing service, you may have noticed it already. The commentary in the GDR Model Outlook section of the daily posts is now more fleshed out with commentary specific to each of the model’s outlook components: Fundamentals, Long-Term, Short-Term, Breadth and Volatility. Hopefully this will help you better understand how the model works and what goes into its determination of bullish, bearish and neutral markets.
That’s all for now! After 3 years, the GDR Model is up a cumulative 57.19% vs the S&P 500’s 29.29%. I hope my posts and model continue to be of help to you and may the outperformance continue!
I look forward to what 2025 will bring. Happy New Year to everyone and thank you for your interest in the GDR Model!